
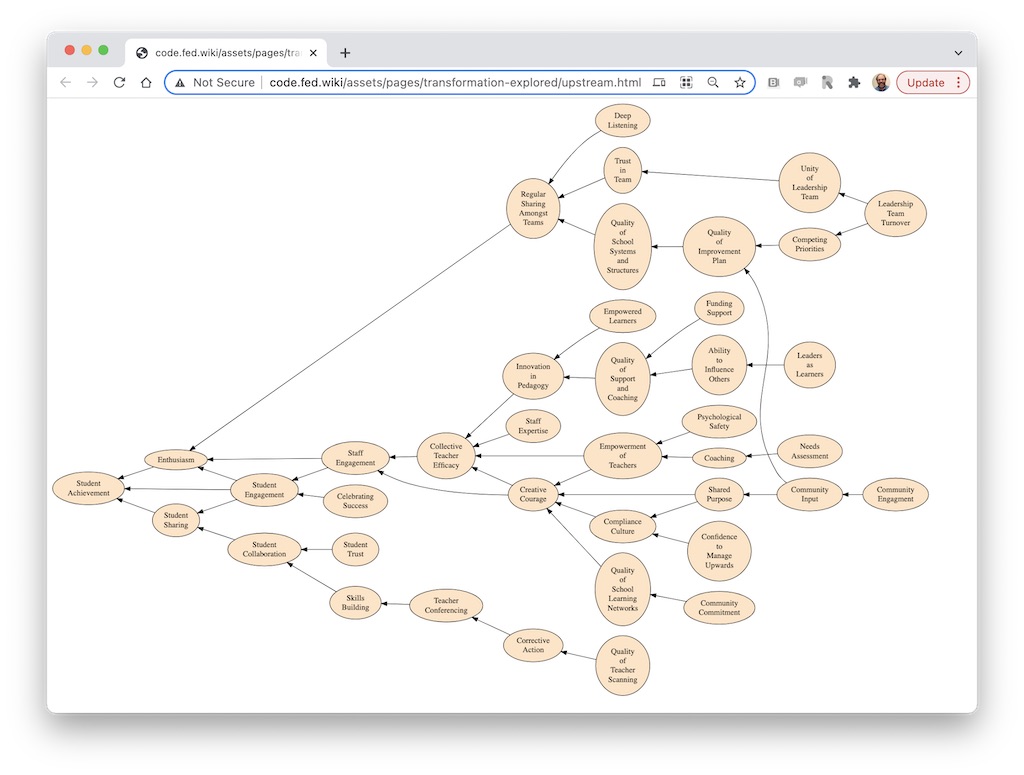
This version of a driver diagram interactively selects a variable for which upstream causes are drawn. github ![]()
The script is hard coded with a starting title present in the .mdl file hard coded in parse.js.
A WASM version of Graphviz draws the diagram as SVG from generated dot syntax. Javascript handles clicks to repeat with a new root.
We've created diagrams from a vensim model that might have additional utility if made interactive.
We explore what leads to Student Achievement. expand ![]()
We have versions of this script that show all variables related by their causes. expand ![]()
I noticed that the Woodcrest Vensim model was partially plain text describing variables and their dependencies. I wondered if graphviz could find a respectable layout knowing full well that handcrafted layout would be better.